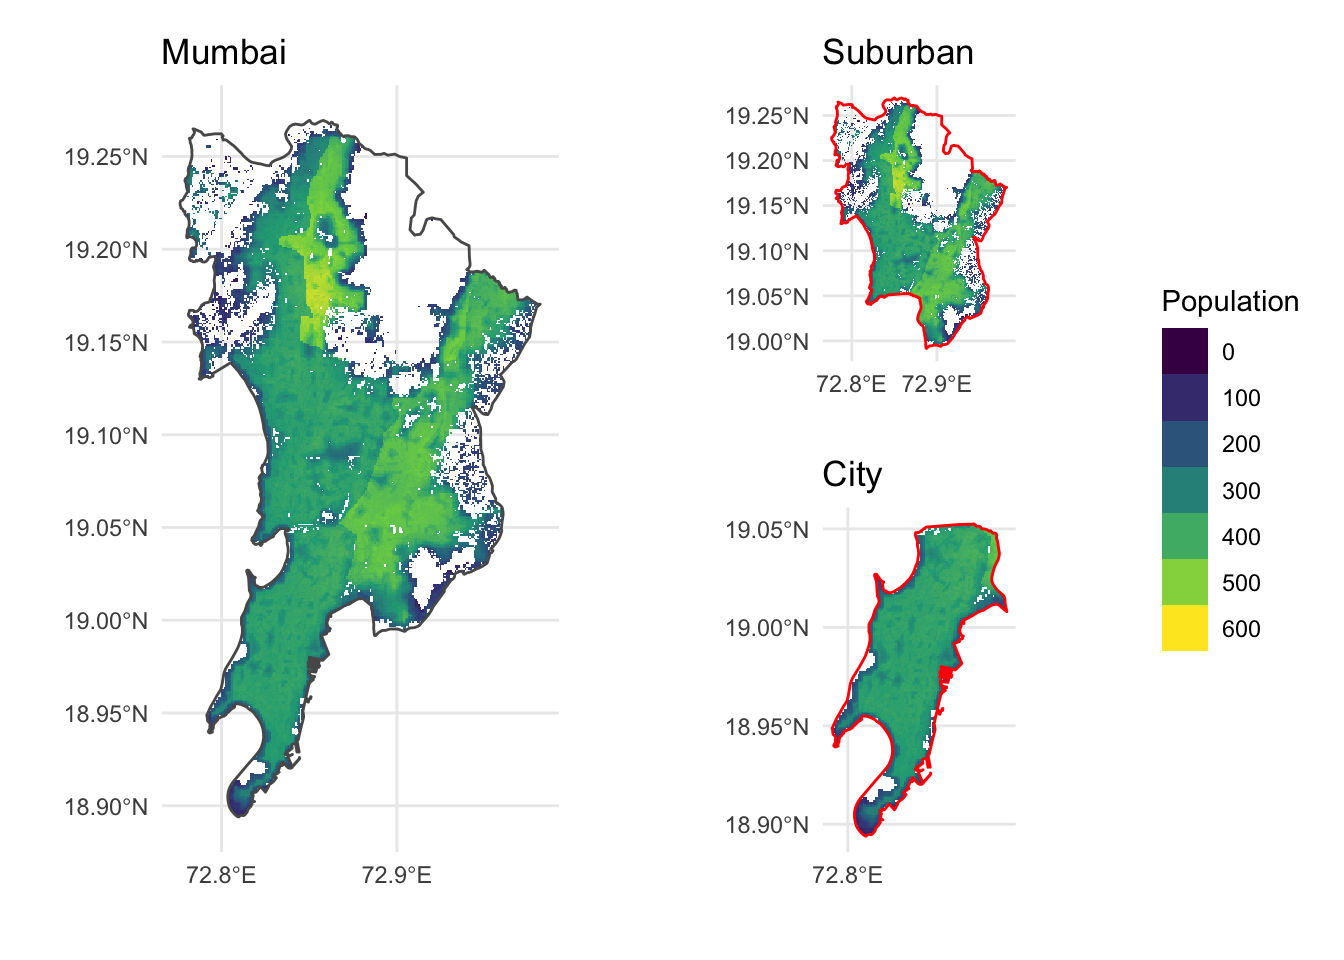
Population distribution in Mumbai
data science
urban
india
mumbai
Mumbai is a city of incredible heterogeneity and diversity. One of the many indicators of this aspect is how and where people live. To answer questions of where people live, we can either find census information per ward or other spatially resolved sources. Census information is unfortunately rather out of date, over 12 years old [1], so an alternative source is required.
The search led me to WorldPop [2] which provides population counts at a 100m\(^2\) spatial resolution. While the WorldPop estimates use clever statistical models for generating spatial distribution of population, the total for Mumbai comes to 13.38 million people as at 2020 [3]. This value is 25% lower than the recent 2023 population estimate of 17.2 million from the Indian government [1]. It is likely that the mismatch results from the Indian population being generated from a generic top-down model that covers the world while the Indian government has projected population using past trends in growth rates specific to the area.
Despite low confidence in its accuracy, the WorldPop dataset was a good opportunity to learn how to wrangle raster data and to combine it with vector data. The population data from WorldPop covers the entire country so cropping to the Mumbai boundaries (full and by the two main districts) was required before any plotting or analysis. After some initial confusion over which package to use, I found that the R package stars [4] is a very convenient way to read raster data into R and the geom_stars geom allows for easy plotting with ggplot2. Usefully, st_crop also works out of the box when combining polygon sf objects with a stars object.
Separating the population counts for the two districts of Mumbai, draws attention apparent homogeneity of Mumbai city. This corresponds well to the more business-centric landuse of Mumbai city especially at the southern tip of Colaba. The northern and eastern areas of Mumbai suburban are significantly more populated than the city district, and are spatially congruous with extensive slum settlements though the population estimates smear out the higher density of slums beyond the expected slum limits.
References
[1]
C. O. of India, “Mumbai (Greater Mumbai) City Population Census 2011-2023 | Maharashtra.” https://www.census2011.co.in/census/city/365-mumbai.html (accessed Feb. 10, 2023).
[2]
M. Bondarenko, D. Kerr, A. Sorichetta, and A. Tatem, “Census/projection-disaggregated gridded population datasets, adjusted to match the corresponding UNPD 2020 estimates, for 183 countries in 2020 using Built-Settlement Growth Model (BSGM) outputs.” University of Southampton, 2020. doi: 10.5258/SOTON/WP00685.
[3]
“The spatial distribution of population in 2020 with country total adjusted to match the corresponding UNPD estimate, india,” 2020. https://hub.worldpop.org/geodata/summary?id=49992
[4]
“Spatiotemporal Arrays, Raster and Vector Data Cubes.” https://r-spatial.github.io/stars/ (accessed Feb. 11, 2023).
Credits
Post photo by Harsh Kondekar on Unsplash