# custom osmplotr function
return_osmplotr_map <- function(bbox, map_title){
  # get data
  structs <- c ("highway", "building", "park", "landuse")
  structures <- osm_structures (structures = structs, col_scheme = "dark")
  structures$value [4] <- "recreation_ground"
  structures$cols[4] <- "#647864FF"

  # make map
  osmplotr_map <- make_osm_map(structures = structures, bbox = bbox)
  plot <- osmplotr_map$map  + labs(title = map_title)
  return(plot)
}

# bounding boxes and extend with spacey function
pc_bbox <- get_centroid_bounding_box(
  c("lat" = 19.01879, "lng" = 72.85141),
  distance = 500,
  dist.unit = "m") %>%
  get_bbox()

be_bbox <- get_centroid_bounding_box(
  c("lat" = 18.93566, "lng" = 72.8401),
  distance = 500,
  dist.unit = "m") %>%
  get_bbox()

# return individual plot objects
p1 <- return_osmplotr_map(pc_bbox, "Parsi Colony, Dadar (Mumbai City)")
p2 <- return_osmplotr_map(be_bbox, "Ballard Estate, Fort (Mumbai City)")

# Compose plot
(p1 + theme(plot.margin = unit(c(0,5,0,0), "pt"))) + (p2) Schematic maps of urban form
data science
urban
india
mumbai
R
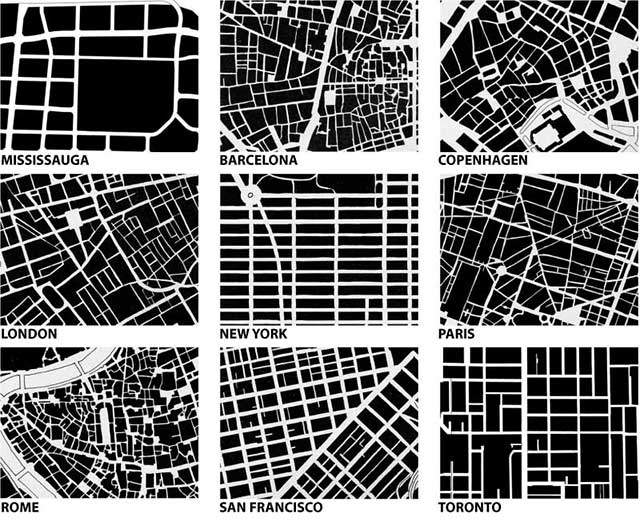
I became interested in the qualitative and quantitative analysis of urban form over a year ago. Architects like Bimal Patel [1] dominate the vast literature of urban form and their classic set of explanatory images are 200m - 500m square schematics of building footprints, plots and street networks. However, there was no tutorial (that I could find) or even examples for creating these in R.

After some googling around for existing code or packages that would help me build the required schematics in a systematic way, I landed on the following franken-hack:
- Specifying a bounding box with consistent extent based on a user specification. The code for this functionality was taken from
spacey[3]. The functionsget_centroid_bounding_box(),extract_coords(),rad_to_deg()anddeg_to_rad()are needed. I keep them in a local R script since I don’t need the other functionality ofspacey. - Using
osmplotr[4] to pull specific spatial elements like parks, building networks and street works and print a visually consistent map. The handymake_osm_map()function both gets the data and outputs the map as aggplotobject. Colours can be set for the different structures in the map. - Using
patchwork[5] to put together multipleggplot2objects for side by side comparison.

References
[1]
“Alain Bertaud, Bimal Patel, Vidyadhar Phatak on Improving Indian Urban Planning - YouTube.” https://www.youtube.com/watch?v=A0_qAk_obLE (accessed Aug. 06, 2022).
[2]
“What is urban fabric? – rethink urban,” Jun. 26, 2012. http://rethinkurban.com/2012/places-and-spaces/understanding-urban-forms/ (accessed Feb. 11, 2023).
[3]
“Spacey: Easily Obtain Spatial Data and Make Better Maps version 0.1.1 from CRAN.” https://rdrr.io/cran/spacey/ (accessed Feb. 11, 2023).
[4]
Ropensci/osmplotr. rOpenSci, 2022. Accessed: Aug. 11, 2022. [Online]. Available: https://github.com/ropensci/osmplotr
[5]
“The Composer of Plots.” https://patchwork.data-imaginist.com/ (accessed Feb. 11, 2023).
Credits
- Post photo from https://www.architecturaldigest.in/story/dadar-parsi-colony-cherishing-the-bombay-that-was-mumbai-history-pictures/