Walking to the park on your computer - adventures in geospatial network analysis
Shrividya Ravi
https://github.com/shriv/maptime-jul21
A simple metric of local walkability
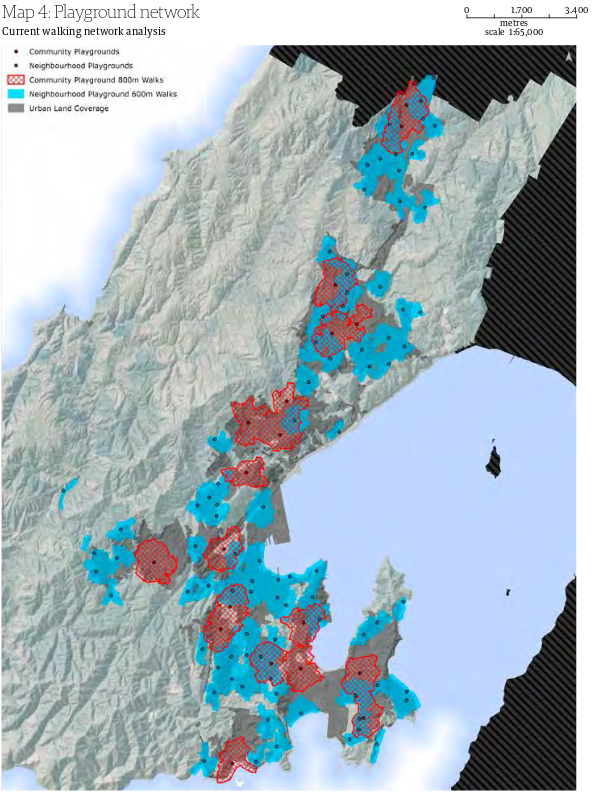
- Local walkability as the distance / travel time to a local amenity that is of value and should be accessible to all residents of the locality.
- Use playgrounds as a municipal amenity that is designed to be a local public space. New Zealand councils prioritise the placement of these playgrounds with a small catchment that they consider 'local'. For Wellington, this is 600m.
Walking on a computer
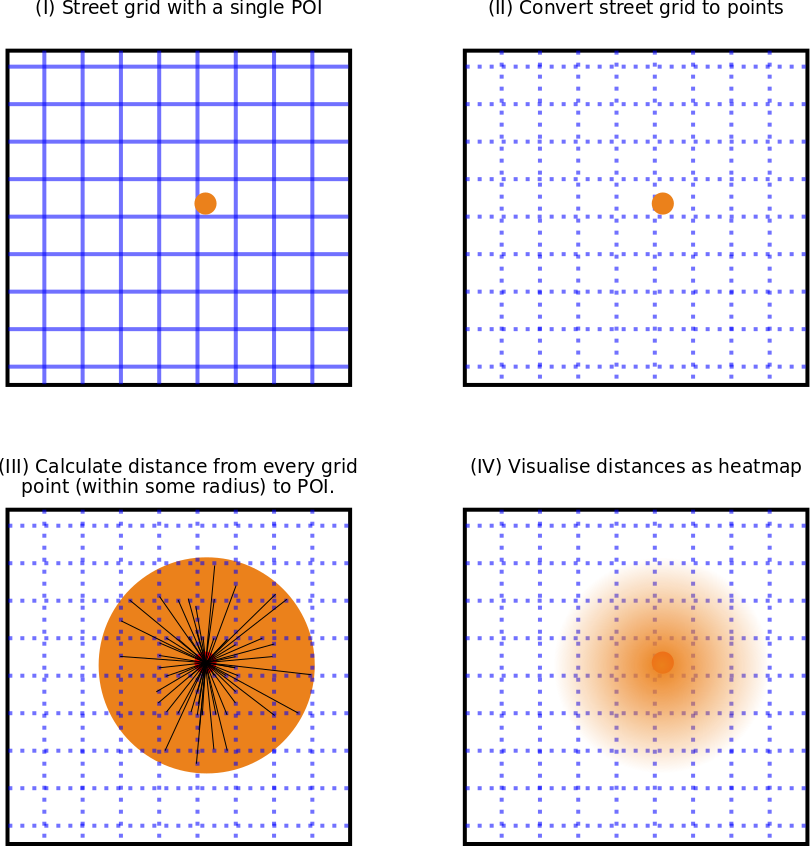
Now that we have a basic metric walkability, how do we collect this data? Surveys would be great but they're expensive! Instead, let's do the walking on our computer..
Build a simplistic model that aggregates walking trips from any point in the city to the closest playground or, generalise to any other Point of Interest (POI).
Datasets
- WCC playground locations
- Downloaded as zip file
- WCC open data portal
- In the github repo
- Wellington street network
- Using Openstreetmap via Overpass API
- Using Openstreetmap via
osmnx
Technical notes for walking on the computer
Basic technical requirements
- Python and some geospatial packages
- Data of playgrounds from WCC
All the requirements are provided as a project environment with a Jupyterlab. More details in the project README
Let's walk!
Playground locations from WCC
import geopandas
import pandas as pd
wcc_playgrounds = geopandas.read_file('zip://./data/WCC_Playgrounds.zip')
wcc_playgrounds.iloc[32:35]
| OBJECTID | location | suburb | playground | Housing | geometry | |
|---|---|---|---|---|---|---|
| 32 | 33 | Kipling Street | Johnsonville | Kipling Street Play Area | No | POINT (174.79808 -41.22495) |
| 33 | 34 | Fraser Avenue | Johnsonville | Gilbert Young Play Area | No | POINT (174.80352 -41.22934) |
| 34 | 35 | Kanpur Road/Rajkot Terrace | Broadmeadows | Kanpur Road Play Area | No | POINT (174.79564 -41.23611) |
# create latitude and longitude
wcc_playgrounds['lon'] = wcc_playgrounds['geometry'].apply(lambda p: p.x)
wcc_playgrounds['lat'] = wcc_playgrounds['geometry'].apply(lambda p: p.y)
wcc_playgrounds.iloc[32:35]
| OBJECTID | location | suburb | playground | Housing | geometry | lon | lat | |
|---|---|---|---|---|---|---|---|---|
| 32 | 33 | Kipling Street | Johnsonville | Kipling Street Play Area | No | POINT (174.79808 -41.22495) | 174.798078 | -41.224946 |
| 33 | 34 | Fraser Avenue | Johnsonville | Gilbert Young Play Area | No | POINT (174.80352 -41.22934) | 174.803516 | -41.229338 |
| 34 | 35 | Kanpur Road/Rajkot Terrace | Broadmeadows | Kanpur Road Play Area | No | POINT (174.79564 -41.23611) | 174.795639 | -41.236107 |
Visualise a playground location (interactively)
import folium
map_playground = folium.Map(location=[wcc_playgrounds.iloc[32]['lat'],
                                      wcc_playgrounds.iloc[32]['lon']],
                            fit_bounds=True,
                            zoom_start = 14)

folium.Marker(location = [wcc_playgrounds.iloc[32]['lat'],
                          wcc_playgrounds.iloc[32]['lon']],
              popup = wcc_playgrounds.iloc[32]['playground']).add_to(map_playground)
<folium.map.Marker at 0x7fb682b102e0>
Visualise all playgrounds (interactively)
Street network from OpenStreetMap (OSM)
OpenStreetMap is a map of the world, created by people like you and free to use under an open licence.
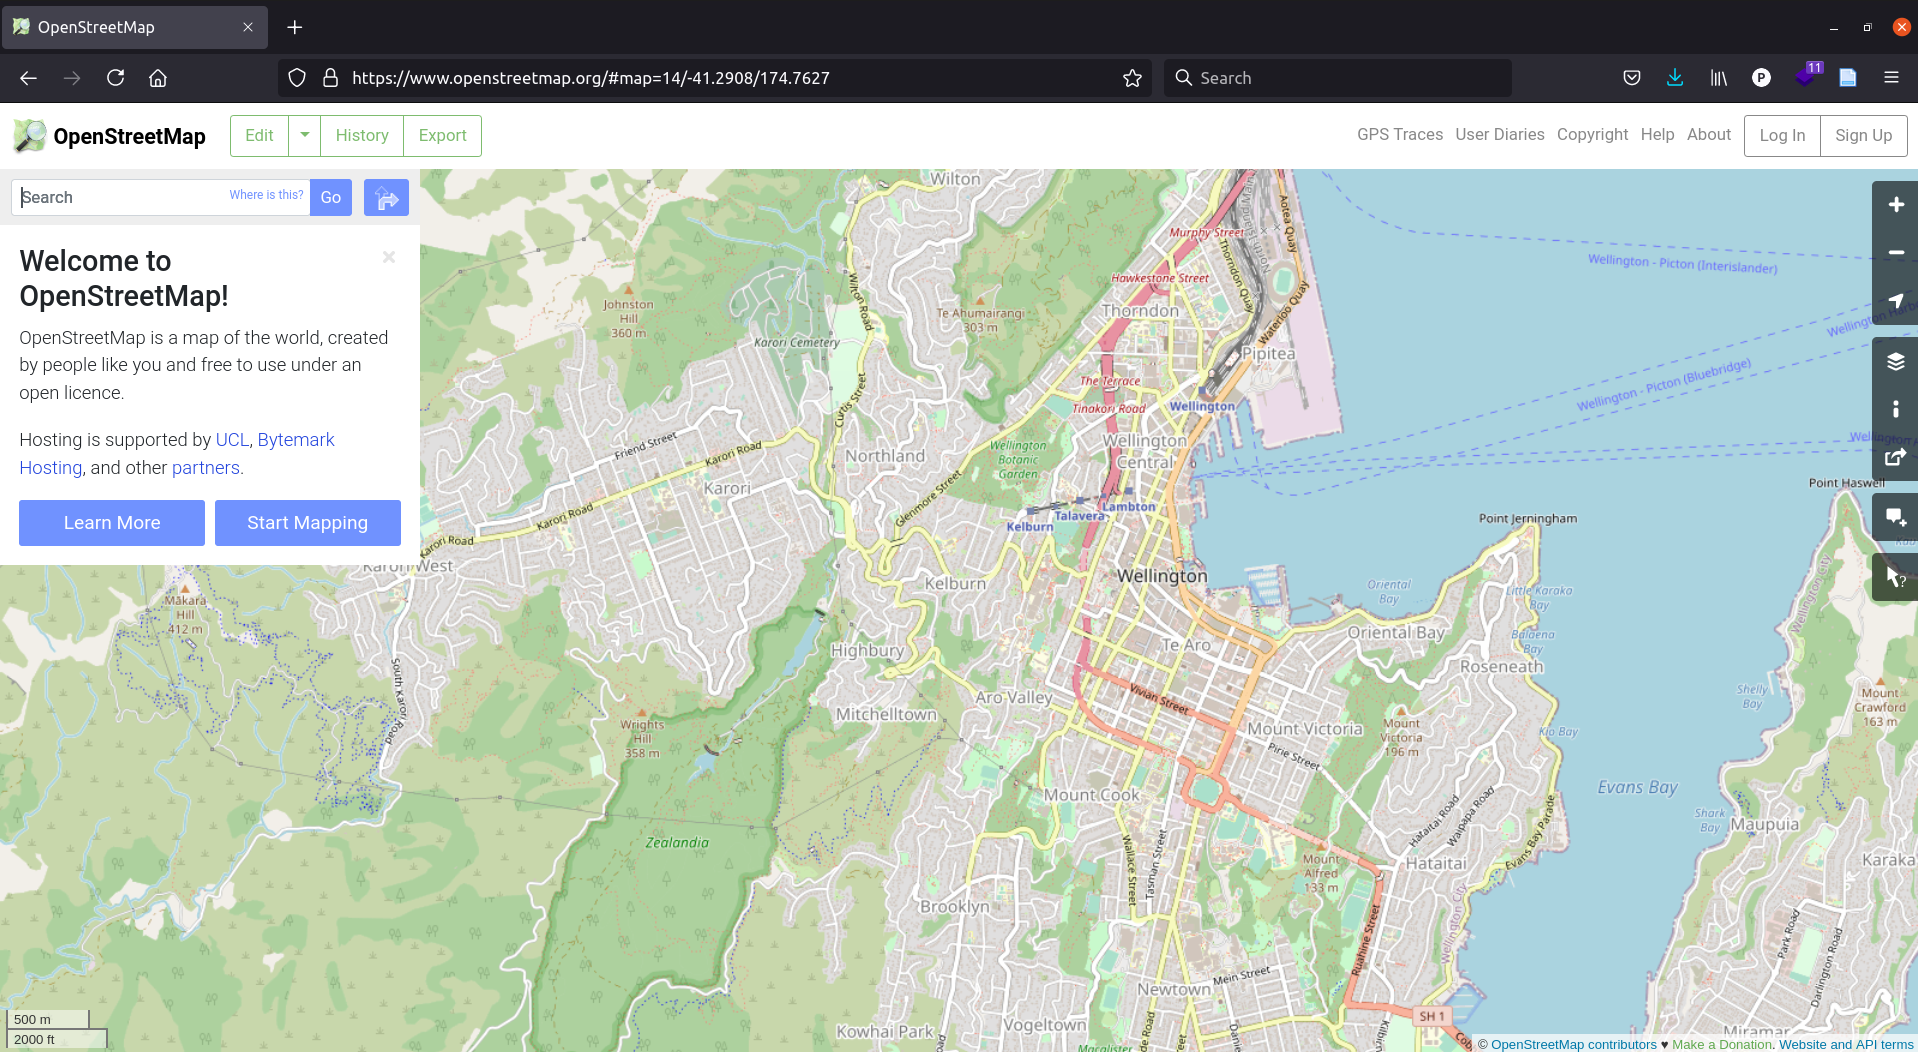
Get OpenStreetMap data
OSM data can be retrieved in a number of ways:
- file download
- via a query and then results download
- through packages that wrap simple functions around the API
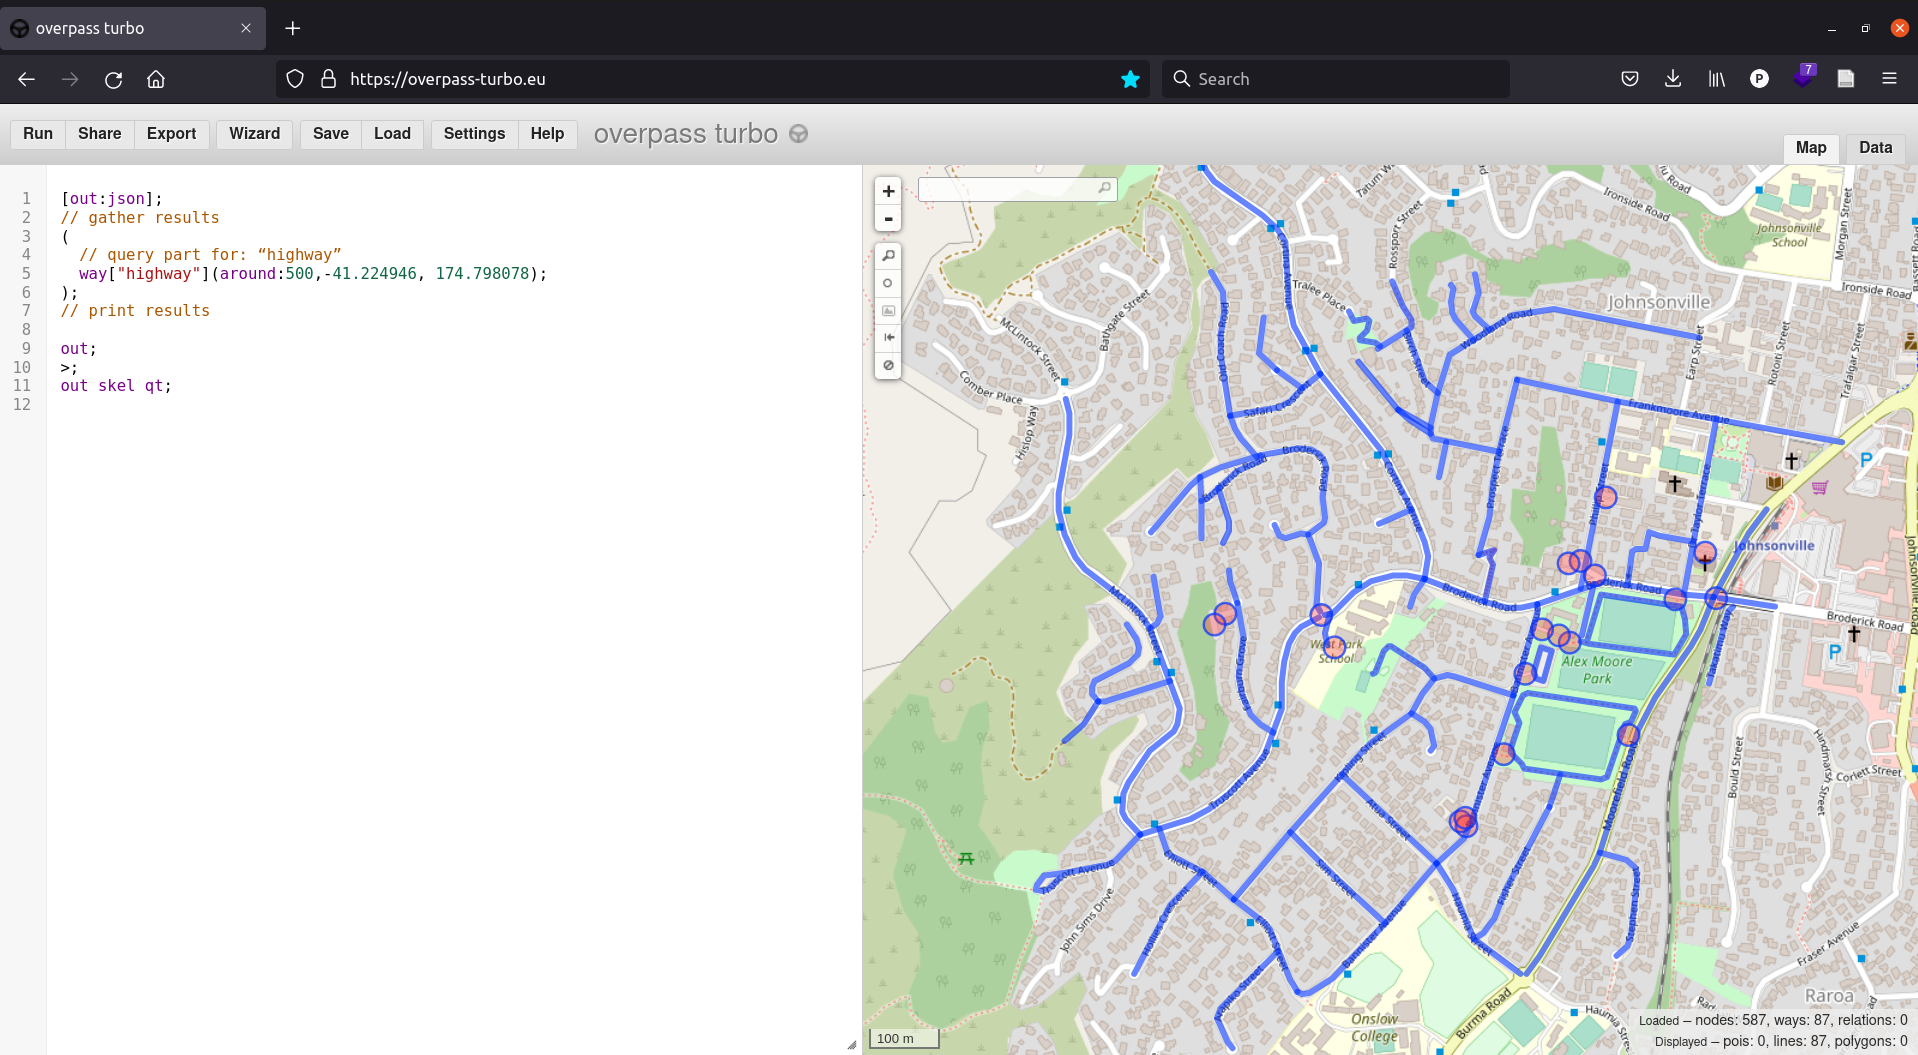
Overpass Turbo is powerful but cumbersome
Use clever packages (like osmnx) to get OSM data
import osmnx as ox
ox.config(log_console=False)
G_sub = ox.graph_from_point((wcc_playgrounds.iloc[32]['lat'],
                             wcc_playgrounds.iloc[32]['lon']),
                            dist=500, network_type='walk')

ox.folium.plot_graph_folium(G_sub, map_playground, fit_bounds=True)
Routable street networks are "graphs"
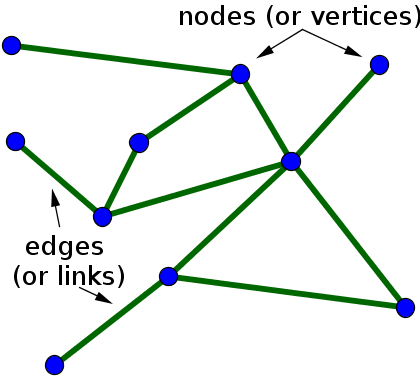
gdf_nodes, gdf_edges = ox.graph_to_gdfs(G_sub)
gdf_nodes.head(2)
| y | x | street_count | highway | geometry | |
|---|---|---|---|---|---|
| osmid | |||||
| 178172965 | -41.229399 | 174.800267 | 3 | NaN | POINT (174.80027 -41.22940) |
| 178172966 | -41.229396 | 174.800385 | 3 | NaN | POINT (174.80039 -41.22940) |
gdf_edges.head(2)
| osmid | name | highway | maxspeed | oneway | length | geometry | junction | service | |||
|---|---|---|---|---|---|---|---|---|---|---|---|
| u | v | key | |||||||||
| 178172965 | 206203155 | 0 | 329990724 | Haumia Street | residential | 50 | False | 87.755 | LINESTRING (174.80027 -41.22940, 174.80015 -41... | NaN | NaN |
| 178172966 | 0 | 329990725 | NaN | secondary | NaN | False | 10.955 | LINESTRING (174.80027 -41.22940, 174.80029 -41... | roundabout | NaN |
Wellington walking network
osmnx can retrieve all relevant OSM entities within a polygon. We can use it to retrieve all walkable streets and paths in the Wellington TLA.
Get the Wellington TLA polygon
wgtn = ox.geocode_to_gdf('Wellington City')
osm_bbox = [wgtn['bbox_south'], wgtn['bbox_west'], wgtn['bbox_north'], wgtn['bbox_east']]
wgtn
| geometry | bbox_north | bbox_south | bbox_east | bbox_west | place_id | osm_type | osm_id | lat | lon | display_name | class | type | importance | |
|---|---|---|---|---|---|---|---|---|---|---|---|---|---|---|
| 0 | POLYGON ((174.61311 -41.28429, 174.61316 -41.2... | -41.14354 | -41.36238 | 174.89541 | 174.613106 | 258924301 | relation | 4266321 | -41.252753 | 174.718471 | Wellington City, Wellington, New Zealand | boundary | administrative | 0.482344 |
wgtn['geometry'][0]
Get walking network within polygon
# Create an OSMNX walking street netwoek for the Wellington bounding box
G = ox.graph_from_polygon(wgtn['geometry'][0], network_type='walk')
from shapely.geometry import Point, Polygon, LineString
from descartes import PolygonPatch

Local walkability is an accessibility calculation
Basics of accessibility: routing
# Get nearest nodes for validation coordinates: 110 John Sim's Drive and Kipling St Play Area
playground_node = ox.get_nearest_node(G_sub, (wcc_playgrounds.iloc[32]['lat'], wcc_playgrounds.iloc[32]['lon']))
start_node = ox.get_nearest_node(G_sub, (-41.2292, 174.7922))

# Get the OSMIDs of the shortest path
route = route = ox.shortest_path(G, orig=playground_node, dest=start_node)
ox.plot_graph_route(G_sub, route, bgcolor = "#ffffff",  node_color="#333333", edge_color="#333333");

Many to many routing for accessibility analysis with pandana
import pandana as pa
# Create a pandana network with data extracted from an OSMNX graph
flat_distance_network = pa.Network(gdf_nodes['x'], gdf_nodes['y'],
                                   gdf_edges['u'], gdf_edges['v'],
                                   gdf_edges[['length']])
Generating contraction hierarchies with 4 threads.
Setting CH node vector of size 17239
Setting CH edge vector of size 43106
Range graph removed 44982 edges of 86212
. 10% . 20% . 30% . 40% . 50% . 60% . 70% . 80% . 90% . 100%
Calculate walking distance to nearest 10 parks
# add wcc playgrounds to the network
flat_distance_network.set_pois(category='all',
                 x_col=wcc_playgrounds['lon'],
                 y_col=wcc_playgrounds['lat'],
                 maxdist=2500,
                 maxitems=10)

# calculate walking distance to nearest park
playground_accessibility_flat = flat_distance_network.nearest_pois(distance=2500, category='all', num_pois=10)
| 1 | 2 | 3 | 4 | 5 | 6 | 7 | 8 | 9 | 10 | |
|---|---|---|---|---|---|---|---|---|---|---|
| id | ||||||||||
| 34543603 | 308.924011 | 1008.682007 | 1302.954956 | 1322.417969 | 1739.904053 | 1820.655029 | 2500.000000 | 2500.000000 | 2500.000000 | 2500.000000 |
| 34543604 | 540.140991 | 1068.238037 | 1081.487061 | 1249.613037 | 1505.187012 | 1579.723999 | 2265.766113 | 2361.254883 | 2395.469971 | 2419.302979 |
| 34543605 | 798.169006 | 865.362000 | 1279.631958 | 1366.114014 | 1545.187012 | 1549.704956 | 1965.673950 | 2095.377930 | 2175.544922 | 2199.719971 |
| 34543610 | 661.002991 | 960.625000 | 1189.099976 | 1370.474976 | 1626.048950 | 1700.586060 | 2240.393066 | 2386.627930 | 2500.000000 | 2500.000000 |
| 34543611 | 924.080017 | 991.273010 | 1240.203003 | 1405.542969 | 1665.727051 | 1671.098022 | 2049.634033 | 2091.584961 | 2221.289062 | 2325.631104 |

plt.hist(playground_accessibility_flat[1], bins=100);
plt.xlabel('Walking distance (m)');
plt.title("WCC playground accessibility: $\mu$ = {:.1f} m".format(np.mean(playground_accessibility_flat[1])));

Park access isochrones
import networkx as nx

Extra analyses
Accounting for hills
- Distance is an excellent metric for driving or walking on flat land.
- For short travels by car or walking on flat land, distance can be directly converted to travel time.
- Most people have an intuitive understanding of their average driving speeds (50 km/h for residential roads in New Zealand) or their approximate walking speed on flat land (usually around 5 km / h for a fit adult as given in Section 3.4 in NZTA pedestrian planning and design guide).
- Hills are not an issue for drivers provided road quality and safety are no different to flat land.
But hills do impact travel time for pedestrians; which in turn impacts walkability.
- Playgrounds are key amenities that can impact the quality of life for young families. Since they are also frequently accessed on foot, it's important to consider how accessible they really are. Particularly for suburbs with a high residential fraction.
Converting distance to travel time
Naismith's Rule and Tobler's Hiking Function calculate travel time as a function of distance and gradient.
Tobler's has a simpler form with a function for speed, $\nu$, as a shifted exponential with three parameters: $a$, $b$ and $c$ which give the fastest speed, speed retardation due to gradient and shift from zero respectively.
| Function | a | b | c |
|---|---|---|---|
| Tobler | 6 | 3.5 | 0.05 |
| Brunsdon | 3.557 | 2.03 | 0.133 |
